an analysis of global public opinion on covid-19
This is the fourth in a series of weekly papers from GQR summarizing and analyzing available data on global opinion on COVID-19.[1] Earlier versions are online at https://www.gqrr.com/case-study/pandemic-pollwatch/.
These papers are not exhaustive in summarizing the global opinion research; there are many aspects (e.g., changes in shopping preferences as a result of the pandemic) not discussed here. Instead, we are focusing on selected aspects of available global opinion research, with an emphasis on political implications, and providing links to all polls identified, so others have a resource for their own investigations.
The major insights in this paper:
- Worldwide, public concern about contracting the virus continues to rise, but global averages show a leveling off in the rate of increase in concern.
- After an early surge in job approval worldwide for governments’ handling of the pandemic, there has been a drop in worldwide averages on public approval. The reversal in job approval on COVID-19 over the past week for President Donald Trump and the US government mirrors a broader, global pattern, although approval of some governments continues to rise.
- Global public opinion consistently and dramatically shows how the pandemic is having a differential economic impact based on people’s class or education/skills levels, with lower-class/less-educated individuals much more harshly affected. The young and racial/ethnic minorities also report particularly high economic costs due to the pandemic.
Major Insights
Worldwide concern about contracting the virus continues to rise, but at a slower rate of increase
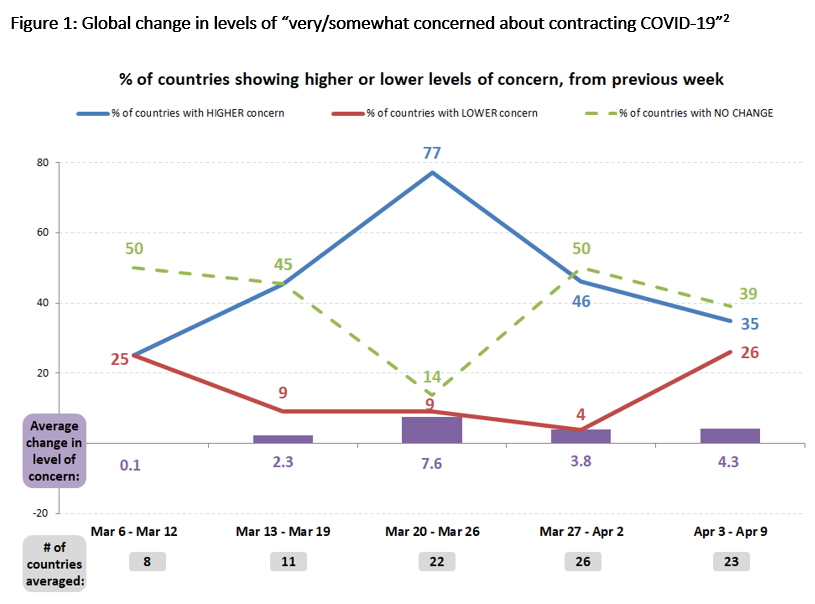
Available global opinion data shows that worldwide levels of public fears about contracting the virus continue to rise. Across the 23 countries for which weekly tracking data on this metric is available this week, the share that is very or somewhat concerned about contracting coronavirus is up by a cross-national average (not population-weighted) of a little more than 4 points. As Figure 1 reveals, however, during late March, the weekly average increase in the world-wide share who feared getting the virus was rising at almost double that rate – a bit more than 7 points per week.
Figure 1 offers other signs that the rate of increase in fears about COVID-19 is leveling off. During the week ending March 26, fully 77% of those countries with tracking data showed an increase from the previous week in the share of their population who were concerned about contracting the virus. Only 9% of the countries with tracking data at that point showed a decline in the share of their populations who were concerned about contracting the virus.
Now, however, far fewer than half of all countries with tracking data (only 35%) are still showing rises in fear levels, while over a quarter (26%) of these countries are showing levels of fear decrease.
After an initial rise, global job approval for government handling of COVID-19 declined on average.
Even as there is some “flattening of the curve” in terms of rising global fears of contracting COVID-19, global publics are turning less positive toward how their governments and leaders handle the pandemic.
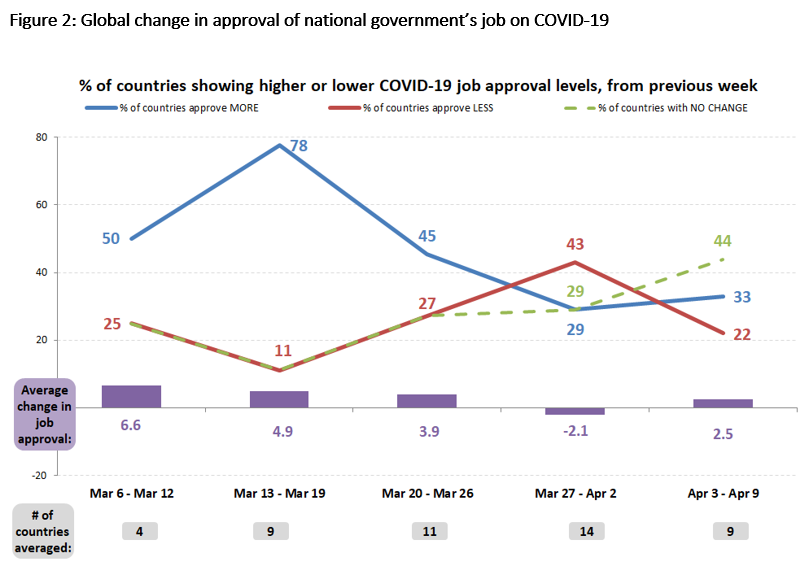
As Figure 2 shows, mid-March saw a spike in public approval of the job national governments were doing in handling the COVID-19 outbreak. Looking across all countries with weekly tracking data on this question, during the week ending March 19, fully 78% of all countries were showing an increase in levels of approval for their government’s handling of COVID-19, relative to the previous week; only 11% were showing COVID-19 job approval levels falling for their government. During those weeks, this publication noted the possibility of a “rally-round-the-flag” phenomenon, as publics placed their faith in leaders and institutions to protect them.
But by the week ending April 2, there had been a reversal in this pattern. That week, only 29% of countries with tracking data saw a weekly increase in job approval ratings for their government’s handling of COVID-19, while 43%, saw distinct declines in such job approval ratings relative to the previous week.
This week, there is a more balanced pattern on COVID-19 job approval. A third of all countries with tracking data (33%) show increases in COVID-19 job approval, while nearly a quarter (22%) show decreases, and nearly half (44%) show no real change in job approval levels. The figures are volatile – in part because of the small number of countries with such data available on a weekly basis – and we will continue to monitor how global COVID-19 job approval ratings trend.
The US provides a notable example of the reversal in job approval that Figure 2 suggests. As this publication noted last week, job approval for President Trump climbed from the mid-40s in early March to the mid-50s by mid-March. But his average job approval rating on COVID-19 for this week is back down into the mid-40s, at 46-50% net disapproval.
Some countries continue to show slow but steady increases in job approval for their governments’ handling of COVID-19. But there is now some reason to believe that the initial global rally in the approval of publics for their governments and leaders may be waning as the pandemic’s toll climbs, in terms of COVID-19 cases, deaths, and economic costs.
COVID-19 having differential impacts, with more harm to poor, disadvantaged, and minorities
Global opinion data also reveals the ways in which COVID-19 is exacting different costs on different kinds of people, worldwide. In particular, the polls show cross-national evidence that the pandemic is imposing economic pain particularly on those with lower-incomes and skill levels, as well as younger workers, and racial and ethnic minorities (there are also differential impacts regarding infection, death rates, and other health aspects; we will address those in future editions). More generally, the combination of a global health crisis and global economic contraction is exposing and deepening divides that already existed – divides along the lines of education, skill levels, and the kinds of work people do.
Apart from public opinion data, many economic analyses conclude that the pandemic will economically hit hardest on particular groups. The International Labor Organization (ILO) reports[3] enormous impacts on workers; ILO estimates 81% of the global labor force will be affected by full or partial workplace closures, and the loss of 6.7% of all working hours globally in the second quarter of 2020. The most affected sectors are accommodation and food services, manufacturing, retail, and business and administrative activities, with the ILO reporting that many of the 1.25 billion workers in these sectors “are in low-paid, low-skilled jobs, where a sudden loss of income is devastating.”
At the country level, McKinsey finds[4] that in the United States, “86 percent of the initial impact affects jobs that were paying less than $40,000 per year. Almost all (98 percent) of the affected jobs paid less than the national living wage of $68,808 for a family of four.” In Britain, the Institute for Fiscal Studies showed[5] that lower-paid workers, as well as those under 25, are much more likely to have jobs in sectors that have shut down due to the crisis, such as restaurants, shops and leisure facilities.
The global public opinion data confirms this differential pattern of the pandemic’s economic impact. In the UK, for example, a Survation[6] poll conducted March 13-17th asked the extent to which people were concerned about the potential impact of coronavirus on “your job.” It found the percentage of people “very” or “quite concerned” was 71% among those earning up to £19,999 (~$25,000)/year; but only 49% among those earning £40,000 (~$50,000) or more. By age group, concern was highest (63%) among 18-34 year olds and fell consistently through higher age groups, down to 37% among those 65 and older.
Similarly, a March 20 YouGov[7] survey in the UK found a higher proportion of people in social grades C2, D and E (i.e. lower-level, routine and manual work) thought that the crisis “will have an impact and the damage will be long lasting” on their household finances (38%), than thought the same among grades A, B and C1 (i.e. professional, managerial and other white-collar jobs) (31%).
The same pattern emerges in the US. An April 2 US survey by YouGov[8] found that 56% of employed people with incomes below $40,000 either had reduced hours or lower pay due to the crisis, or had lost their jobs entirely. This figure was only 43% among employees earning $40-80,000, and only 34% among those with incomes of $80,000+. Within these figures, reports of job loss were highest among the lowest-paid (28%), and were lowest among the highest-paid (9%).
These same patterns emerge from opinion research data in other countries as well:
- In Brazil, Datafolha[9] asked how people expected the outbreak to affect their personal finances. Among the lowest earners, 32% thought the crisis “will damage my financial life for a long time”; but the figure was only 19% among the highest earners.
- In France, 52% of upper- and middle-class professionals expect their personal finances to deteriorate in the coming months, but the figure is 59% among lower-middle and working-class people, according to a March 31 OpinionWay poll.[10]
- A March 23 Angus Reid poll in Canada found that 30% of those earning less than C$50,000 (~US$36,000) had been laid off or lost work hours; but the figure was only 23% among those earning $50-100,000 (~US$36,000-72,000), and only 21% among those earning $100,000+.[11]
- In Portugal, ISC-ULisboa[12] found that if the coronavirus restrictions continue for another month, 57% of people without higher education would need to reduce spending or struggle to meet even basic expenses, while just 34% of those with higher education would face the same challenge.
- In South Korea, an April 2 Gallup survey[13] found that 54% of the South Korean public now faces reduced household income as a result of the COVID-19 outbreak (by way of comparison, in the middle of the 2015 MERS outbreak, that number in South Korea was only 26%). Among those in the lowest income group, 64% faced reduced household income, while it was only 41% among those with upper/middle incomes. The figure was even lower, 34%, among those in office and management occupations.
There are complex reasons for the differential income/class impacts of the pandemic; but part of the pattern stems from differences in the nature of work done by people in different occupations, income, and education levels – which are often but not always interconnected. The COVID-19 crisis particularly exposes a divide between people who are able to work at home and those who are not:
- In the US[14], among people earning below $40,000, 28% say they always or sometimes worked at home before the crisis, rising to 39% now. But among people earning $80,000 or more, 40% already worked from home some or all of the time pre-crisis, and 68% do now. The differences are even more dramatic when broken down by education: 82% of those with post graduate education now work from home at least some of the time, compared to only 36% of people with high school or less.
- US data also exposes a racial divide in people’s ability to work at home. The Economic Policy Institute[15], citing the American Time Use Survey (2017-18) from the US Bureau of Labor Statistics, shows that while 30% of white Americans can telework, just 20% of African Americans can. The difference also affects Hispanics, with 16% able to work from home compared to 31% of non-Hispanics. Asian Americans are the most likely to be able to work from home, at 37%.
- In the UK, Ipsos MORI[16] found that among working people, 50% of professionals and managers had begun working from home due to the crisis, but only 40% of lower-level white collar employees, only 22% of skilled manual workers, and only 17% among those in manual and routine occupations.
- The Datafolha survey in Brazil[17] found that 75% of top earners said they would be able to work from home during the crisis; but the level was only about half as high, 40%, of those in the lowest income category.
- In Germany, a March 10 YouGov[18] poll found that 21% of people earning less than €18,000 (~$20,000) per year had a job where home working might be possible, compared to 43% of those earning above €36,000 (~$40,000) per year.
- According to a March 21 Ipsos[19] survey in Peru, 34% of employees in the top social grade (class A) there report they are teleworking through the crisis; but only 4% of employees in the bottom grades (classes D/E).
There is not public opinion data from every country regarding these kinds of differential economic impacts across class, income, education, and skill. But we did not find a single country in which the available opinion data contradicts this general pattern. That is, we find no case worldwide in which polls show economic impacts or fears to be less severe among a country’s lower class/income/education/skill levels, or in which the lower class/income/education/skill levels report a greater ability to work from home or otherwise adapt to the economic dislocations imposed by the pandemic. These patterns have enormous implications for national and global politics and economic development, and we will continue to monitor them in future editions.
[1] Our first three installments of Pandemic PollWatch, on March 19, March 27, and April 2, reviewed a total of 210 polls from 75 different geographies (generally countries, but also polling on Hong Kong). This week’s analysis reviews an additional 113 polls, covering 51 countries and geographies, increasing the total number of geographies with reviewed public opinion data up to 82. Links to all new polls reviewed for this edition are listed in the Appendix. The Appendices for the first three editions, all available here, include links to all the earlier polls reviewed. As the Appendix notes, polls reviewed here vary significantly in methodology and reliability.
[2] For both Figures 1 and 2, data only compiled for countries having week-on-week public polling on fear of contracting COVID-19. Countries only counted as showing an “increase/decrease” if the week’s change is at least 3 percentage points. Average for change in level of concern is not population-weighted across countries. Question wordings may differ somewhat across countries and weeks.
[3] ILO Monitor 2nd edition: COVID-19 and the world of work: Updated estimates and analysis, International Labor Organization, April 7, 2020. Released here: https://www.ilo.org/global/about-the-ilo/newsroom/news/WCMS_740893/lang–en/index.htm
[4] Lives and livelihoods: Assessing the near-term impact of COVID-19 on US workers, McKinsey & Company, April 2020. https://www.mckinsey.com/industries/public-sector/our-insights/lives-and-livelihoods-assessing-the-near-term-impact-of-covid-19-on-us-workers
[5] Sector shutdowns during the coronavirus crisis: which workers are most exposed? IFS Briefing Note BN278, April 6, 2020. Report available at: https://www.ifs.org.uk/publications/14791
[6] COVID-19: Survey finds high levels of anxiety in Britain for jobs, the economy, and public health, Survation, March 20, 2020 (survey fieldwork: March 13-17)
[7] Coronavirus: Young Brits most worried about jobs and wages: YouGov, UK, March 25. Survey fieldwork March 19-20. Tables: http://docs.cdn.yougov.com/tj4vgxcfux/Internal_Coronavirus_200320.pdf
[8] YouGov US National Survey, USA, March 25-April 2. Tables: https://docs.cdn.yougov.com/vcdyfzscti/Coronavirus%20results%20(March%2025-April%202,%202020).pdf
[9] Datafolha Economics and Personal Finance Survey, Brazil, March 18-20. Report and tables: http://media.folha.uol.com.br/datafolha/2020/03/24/400cb85515438611d021b62715fa6dc2ec.pdf
[10] OpinionWay, France, fieldwork March 30-31. Tables: https://f.dviz.factoviz.com/UserFiles/b/f/b/OpinionWay-et-Square-pour-Les-Echos-CoviDirect-Vague 8.pdf
[11] Angus Reid, Canada, fieldwork March 20-23. Tables: http://angusreid.org/wp-content/uploads/2020/03/2020.03.23_coronatracking4final.pdf
[12] ISC-ULisboa, fieldwork March 20-22. Report: https://sondagens-ics-ul.iscte-iul.pt/wp-content/uploads/2020/03/Sondagem-ICS_ISCTE_Mar%C3%A7o2020_Covid.pdf
[13] Gallup Korea, South Korea, fieldwork March 31-April 2. https://www.gallup.co.kr/gallupdb/reportContent.asp?seqNo=1096
[14] YouGov US National Survey, USA, March 25-April 2. Tables: https://docs.cdn.yougov.com/vcdyfzscti/Coronavirus%20results%20(March%2025-April%202,%202020).pdf
[15] “Not everybody can work from home: Black and Hispanic workers are much less likely to be able to telework.” Elise Gould and Heidi Shierholz, Economic Policy Institute, March 19. https://www.epi.org/blog/black-and-hispanic-workers-are-much-less-likely-to-be-able-to-work-from-home/
[16] Ipsos MORI Coronavirus Omnibus Polling, March 27-30. Tables: https://www.ipsos.com/sites/default/files/ct/news/documents/2020-04/ipsos_mori_coronavirus_omnibus_polling_030420_v2.pdf
[17] Datafolha Economics and Personal Finance Survey, Brazil, March 18-20. Report and tables: http://media.folha.uol.com.br/datafolha/2020/03/24/400cb85515438611d021b62715fa6dc2ec.pdf
[18] YouGov, Germany, March 10. Results: https://yougov.de/opi/surveys/results/#/survey/0b8fecfc-62ac-11ea-ac48-23aae93298cd
[19] Ipsos, Peru, March 20-21. Report and tables: https://www.ipsos.com/sites/default/files/ct/news/documents/2020-03/encuesta_de_opinion-_cuarentena_covid-19.pdf
Appendix
This analysis is based on available global public opinion research on the COVID-19 pandemic. We welcome input from others – including insights about opinion trends and dynamics, and about additional public opinion research that is not included here.
Countries and territories with published public opinion data on COVID-19 at this point include:
- Afghanistan
- Algeria
- Argentina
- Armenia
- Australia
- Austria
- Azerbaijan
- Belgium
- Bolivia
- Bosnia & Herzegovina
- Brazil
- Bulgaria
- Canada
- Chile
- China
- Colombia
- Cyprus
- Denmark
- Estonia
- Dominican Republic
- Ecuador
- Egypt
- El Salvador
- Finland
- France
- Georgia
- Germany
- Greece
- Guatemala
- Hong Kong
- Hungary
- India
- Indonesia
- Iran
- Ireland
- Israel
- Italy
- Japan
- Jordan
- Kazakhstan
- Kenya
- Kyrgyzstan
- Latvia
- Lithuania
- Luxembourg
- Malaysia
- Malta
- Mexico
- Morocco
- North Macedonia
- The Netherlands
- New Zealand
- Nigeria
- Norway
- Pakistan
- Palestine
- Peru
- Philippines
- Poland
- Portugal
- Qatar
- Romania
- Russia
- Saudi Arabia
- Singapore
- Slovakia
- Slovenia
- South Africa
- South Korea
- Spain
- Sweden
- Switzerland
- Taiwan
- Thailand
- Turkey
- Ukraine
- United Arab Emirates
- United Kingdom
- United States
- Uruguay
- Venezuela
- Vietnam
The reliability of the public opinion data from these geographies varies – and affects the analysis – for several reasons. First, some of these countries, such as China, Russia, and Saudi Arabia, are “not free” (according to rankings by Freedom House) and respondents in these countries may not feel free to give their actual opinions in a survey.
Second, the methodologies used in these surveys vary, and few are “gold standard” quality. The pandemic has driven researchers in most geographies to rely on online surveys, which generally do not have probability-based samples and can suffer from opt-in bias. Sample sizes and quality control procedures also vary across the available surveys.
The polls reviewed for this edition of Pandemic PollWatch (with links in all possible cases) are listed below. The three earlier editions of Pandemic PollWatch, available here, include links to all the previous COVID-19-related polls summarized in this series.
Argentina
- D’AlessioIROL/Berensztein; March 1-31; 1,126 adults; online; link
- AnalíticaConsultores Asociados; March 16-22; 16,015 respondents; link
- Instituto de CienciasSociales y Disciplinas Proyectuales (INSOD); March 13-17, 2020; 1,008 adults; online; link
- Raúl Aragón y Asociados; March 15-16; 900 adults; telephone; link
- UADE Institute of Social Sciences and Project Disciplines; March 13-17, 2020; 1,008 respondents; online; link
Australia
- Roy Morgan; April 4-5, 2020; 988 adults; online; link
- Essential Research; April 2-5; 1,069 adults; online; link
- Newspoll; April 1-3; 1,508 adults; online; link
Bolivia
- CiesMori; March 28-31, 2020; 1,072 adults; unspecified; link
Brazil
- Datafolha; April 1-3; 1,511 adults; telephone; link
- FSB; March 18-19, 2020l 2,000 people over 16; telephone; link
Bulgaria
- Gallup International; March 24, 2020; 1,000 adults; CATI; link
Canada
- Angus Reid Institute; April 1-3; 2,162 adults; online; link
- Ipsos; April 3-7; 1,006 adults; online; link
- Public Square Research & Maru/Blue; March 25-27; 4,700 adults; online; link
- Leger; April 3-5; 1,512 Canadian and 1,000 American adults; online; link
- Campaign Research; March 31 – April 1; 2,659 adults; online; link
Chile
- C&E Research y Demotáctica; 25,600 adults; telephone; link
- Criteria; March 26-30, 2020; 800 adults; online; link
Estonia
- Turu-uuringuteAS; March 22; 1,257 adults; telephone & online; link
- Turu-uuringuteAS; March 28; 2,037 adults; telephone & online; link
- Turu-uuringuteAS; April 4; 2,031 adults; telephone & online; link
France
- Elabe; April 6-7, 2020; 1,005 adults; online; link
- Elabe; March 30-31, 2020; 1,003 adults, online; link
- OpinionWay; April 6-7, 2020; 1,111 adults; CAWI; link
- Odoxa-CGI; March 25-30, 2020; 3,004 adults; unspecified; link
Germany
- Civey; March 23-April 7, 2020; 10,069 respondents; online; link
- Redfield & Wilton Strategies; April 5-6, 2020; 1,500 adults; online; link
Greece
- About People; April 4, 2020; 867 adults; unspecified; link
- Pulse; March 30 – April 1, 2020; 1,245 people; telephone; link
- ALCO; March 25- April 1, 2020; 1,000 people; unspecified; link
- Interview and Pulse; March 27-March 31, 2020; 1,200 respondents; CATI; link
India
Italy
- IstitutoIxè; April 6-7, 2020; 1,000 adults; CATI, CAWI; link
- SWG; March 30-April 5, 2020; 400 adults; CAWI link
- Tecnè; April 2-3, 2020; 1,000 adults; CATI, CAWI, CAMI; link
- Demopolis; March 30-31; 1,500 adults; CATI, CAWI, CAMI; link
- PiepoliInstitute; March 24-30, 2020; 505 adults; CATI,CAWI; link
Japan
- Mainichi Shimbun/Center for Social Research; April 8; 2,190 respondents; link
- Thomson Reuters; March 30 – April 6; of economists; unspecified; link
- Leading Tech Co.; April 3; 1,200 adults; online; link
- JNN; April4-5, 2020; 1,327 people; phone; link
- MinyuNet; April 3, 2020; 1,200 adults; online; link
- Nihon Keizai Shimbun/TV Tokyo; March 27-29; 1,085 respondents; unspecified; link
- Fuji TV Public Opinion Survey; March 21-22; 1,077 respondents; unspecified; link
- TV Asahi; March 21-22; 1,097 respondents; unspecified; link
Jordan
- Word of Opinion Center; March 16-21, 2020; 552 respondents; online; link
Kenya
- Infotrak; March 30-April 2, 2020; 831 adults; interview; link
Kyrgyzstan
- MVector; March 13-16, 2020; 431 adults; unspecified; link
Mexico
- De La Heras; March 30-April 3, 2020; 4,791 adults; online; link
- Comunicacion Politica; March 17, 2020; 1,000 adults; telephone; link
- De La Heras; March 30-April 3, 2020; 4,791 adults; online; link
- Comunicacion Politica; March 17, 2020; 1,000 adults; telephone; link
Netherlands
- I&O Research; March 26-30 2020; 2,342 adults; panel and online; link
New Zealand
- Colmar Brunton; 3-5 April, 2020; 601 adults; online; link
- Stickybeak; March 23-27; 6000 adults; online; link
Palestine
- Arab World for Research and Development; March 28-31, 2020; 800 respondents; online; link
Peru
- Ipsos; March 20-21, 2020; 800 respondents; link
Poland
- IBRiS; April 7, 2020; 1,100 respondents; CATI; link
- Pollster Research Institute; April 6-7, 2020; 1,054 adults; unspecified; link
- IBRiS; April 3-4, 2020; unspecified; CATI; link
- Kantar; March 25-31; 800 adults; CATI; link
Portugal
- ISC-ULisboa; March 20-22; 625 adults; telephone;link
Romania
- Republika; March 26-31, 2020; 1,000 adults; unspecified; link
Qatar
- Social and Economic Survey Research Institute (SESRI) from Qatar University; March 12-14, 2020; 2,131 respondents; telephone; link
Saudi Arabia
- APCO; April 2-5; 500 respondents; unspecified; link
South Korea
- Realmeter; April 6-8, 2020; 1,509 adults; telephone; link
- Gallup Korea; March 30-April 2, 2020; 1,002 adults; phone; link
- Hankook Research; March 27-30, 2020; 1,288 respondents; link
- Kstat; March 27- March 29, 2020; 1,014 respondents; online; link
Spain
- GAD3; March 30-April 2, 2020; 741 respondents; CATI; link
- GAD3; March 30-April 3, 2020; 457 respondents; CAWI; link
- GESOP; March 23-27, 2020; 671 respondents; link
- NC Report; March 25-28, 2020; 800 interviews with elderly Spaniards; telephone; link
- Colegio Oficialde Ingenieros Industriales de Madrid; March 11-12, 2020; 588 respondents; link
Sweden
- Vetenskap& Allmanhet; March 18-21; 1,141 adults; online; link
- Novus; April 5-6, 2020; 1,173 respondents; link
Taiwan
- TvbsPoll Center; March 20-25, 2020; 1,056 respondents; phone; link
- German Trade Office Taiwan; March 3-6, 2020; 250 German companies; flash survey; link
Thailand
- Suan Dusit Rajabhat University; March 31-April 3; 3,183 adults; unspecified; link
Turkey
- MAK Consulting Group; April 7, 2020; 2,600 people; phone; link
UAE
- YouGov; March 25-31; 2,028 adults; unspecified; link
United Kingdom
- YouGov; April 6-7, 2020; 1,609 adults; online; link
- Populus; April 3-5, 2020; 2,093 adults; online; link
- Opinium; April 1-3, 2020; 2,000 adults; online; link
- Redfield & Wilton Strategies; March 30; 1,500 adults; online; link
- Ipsos MORI; March 27-30, 2020; 1,072 adults; online; link
- YouGov; March 23 – April 2, 2020; 2,972 adults; online; link
Uruguay
- Equipos Consultares; March 20-21, 2020; 1,100 respondents; online; link
United States
- Navigator; April 3-8, 2020; 1,022 registered voters; online; link
- Ipsos; April 6-7, 2020; 1,116 registered voters; online; link
- YouGov; April 5-7, 2020; 1,500 adults; online; link
- Navigator/Global Strategy Group/GBAO; April 2-7, 2020; 1,007 registered voters; online; link
- Civiqs; February 25-April 7, 2020; 18,537 responses; online; link
- Hart Research/Public Opinion Strategies; April 3-6, 2020; 804 adults; link
- CamBright-Dynata; April 3-7, 2020; 500 respondents; online; link
- YouGov; April 4-5, 2020; 1,000 adults; online; link
- SRRS; April 3-6; 1,002 respondents; telephone; link
- University of North Florida; March 31-April 4, 2020; 3,244 Registered Florida Voters; online; link
- Quinnipiac; April 2-6, 2020; 2,077 registered voters; telephone; link
- Morning Consult; April 3-5, 2020; 1,586 registered voters; link
- Microsoft News and Microsoft Research; March 3-April 2, 2020; 939,423 responses; online; link
- Strada Education; April 1-2, 2020; 1,000 adults; online; link
- Harvard Medical School and RAND Research; March 21-24, 2020; 10,750 doctors; online; link
- PwC; March 21-23, 2020; 55 finance leaders from US and Mexico; link
- Rust Belt Rising; March 21-23, 2020; 2,040 likely voters; online; link
- Ipsos/Axios; March 27-30, 2020; 1,092 adults; online; link
- AP-NORC; March 26-29, 2020; 1,057 adults; online; link
- Monmouth University; March 18-22, 2020; 851 adults; telephone; online; link
Multi-Country
- Multi-Country (Australia, Denmark, Germany, Indonesia, Malaysia, Philippines, Spain, Thailand, USA, Canada, Finland, Hong Kong, Italy, Mexico, Saudi Arabia, Sweden, UAE, Vietnam, China, France, India, Japan, Norway, Singapore, Taiwan, UK); YouGov; April 7; around 27,000 adults; online; link
- Multi-Country (Russia, Vietnam, Australia, Spain, France, Brazil, Mexico, US, India, China, Germany, UK, Canada, Italy, Japan); Ipsos; April 2-4; 28,000 adults; online; link
- Multi-Country (France, Spain, Italy, UK, Belgium, Poland, USA, Germany, Switzerland); YouGov ; March 24-30, 2020; 10,963 adults; unspecified; link