an analysis of global public opinion on covid-19
This is the third in a series of regular papers from GQR summarizing and analyzing available data on global opinion on COVID-19.[1] Earlier versions are available online HERE.
These papers are not exhaustive in analyzing the global opinion research; there are many aspects (e.g., changes in TV viewing preferences as a result of the pandemic) not probed here. Instead, we are focusing on selected aspects of available global opinion research, with an emphasis on political implications, and providing links to all polls we have identified, so others have a resource for their own investigations.
The major insights in this paper:
- There is now increasing evidence that levels of concern about contracting the virus do not correlate strongly with known in-country infection rates (or death rates) at the time of the surveys.
- While previous polls generally showed world leaders with relatively strong approval ratings for handling the COVID-19 crisis, ratings for some key leaders and governments are leveling off or declining.
- There is global evidence that publics generally are receptive to strong policy responses to the pandemic from national governments. Correlations based on a cross-national “Stringency Index” developed by researchers at Oxford University provides mixed signs about the relationship between governments’ policy responses and levels of approval for government’s job in battling COVID-19 and/or the overall job approval of the country’s leader; but at least in some countries it does suggest some relationship.
Major Insights
Concern about contracting the virus lacks strong correlation to number of in-country cases or deaths
Previous editions noted that levels of concern about contracting the virus have been high and rising in nearly all places. That continues to hold true, although the degree of increase has slowed as concern reaches high levels in more countries. An April 2 update of YouGov’s tracking poll of 26 geographies shows increases of at least 3 points in the share who are “very” or “somewhat scared they will contract the coronavirus (COVID-19)” in 11 of the 21 places with new data, and declines of at least 3 points in none. It also shows a leveling off of worry in some of the places that already had very high concern rates, such as Malaysia holding steady at 90%, or the Philippines moving from 81% to 80%.
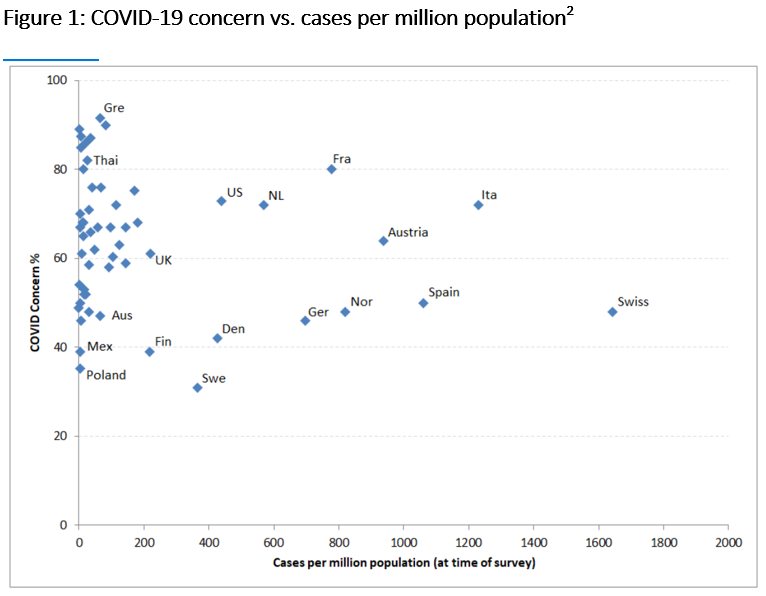
Previous editions also noted on an anecdotal level that the levels of concern in each country did not fully correlate to the number of reported COVID-19 cases in that country. With more countries reporting such opinion data, there is now even stronger support for this conclusion. Figure 1, which analyzes levels of concern and number of reported cases (at the time of the survey) in 55 countries and territories, shows a very low level of correlation (-0.17) between these variables.
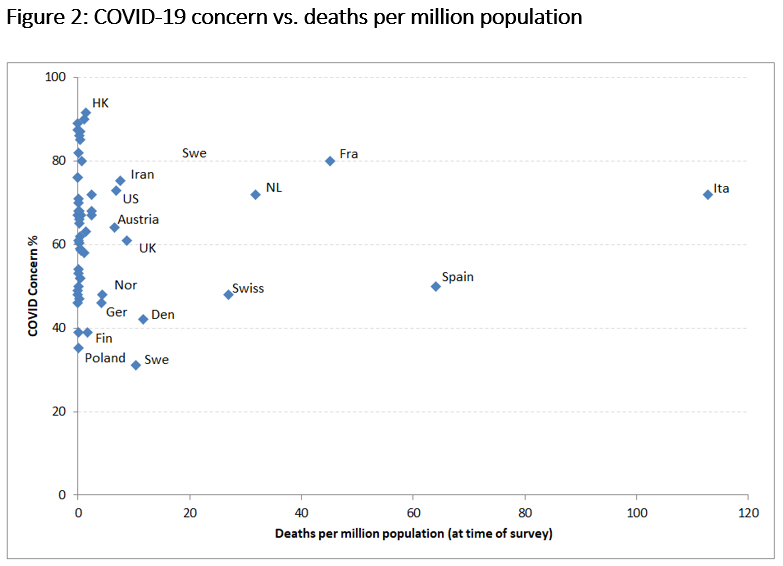
As Figure 2 reveals, the result is about the same looking at number of reported deaths rather than number of reported COVID-19 cases. There is again almost no correlation; indeed, the correlation coefficient here is even weaker, only 0.01.
There are obviously numerous other factors, beyond reported number of cases and deaths, which might influence levels of concern about infection. These could include such variables as: proximity to other countries with higher infection rates; trust in government and health institutions; trust in media and other information sources; various cultural dynamics; etc. Later research may explain what has driven relative national rates of concern, but at this point it does not seem to be primarily a result of national infection and death rates.
Signs of some major leaders losing ground on job approval on COVID-19
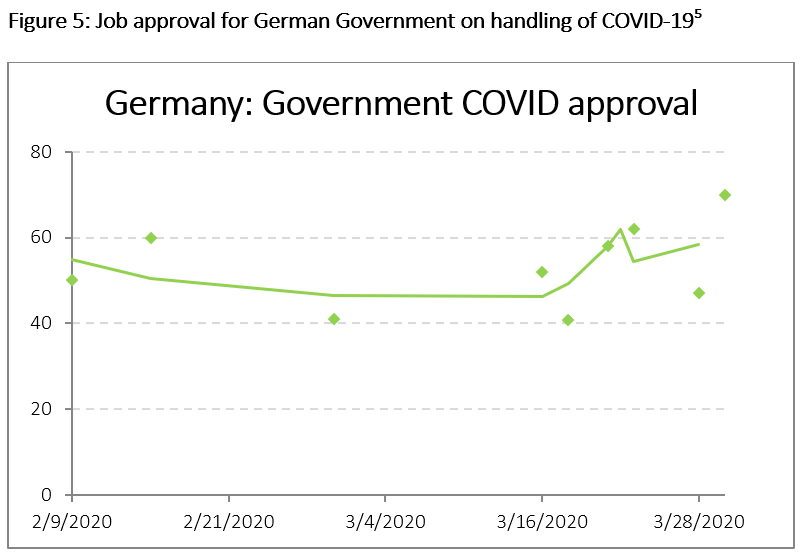
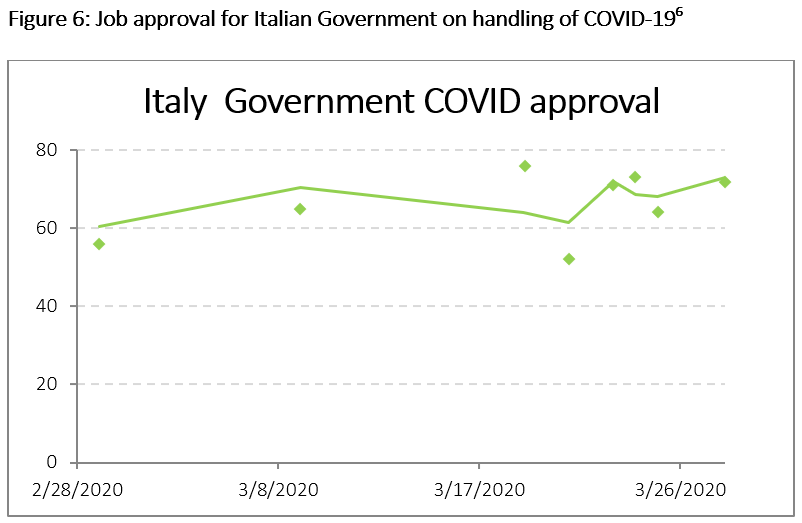
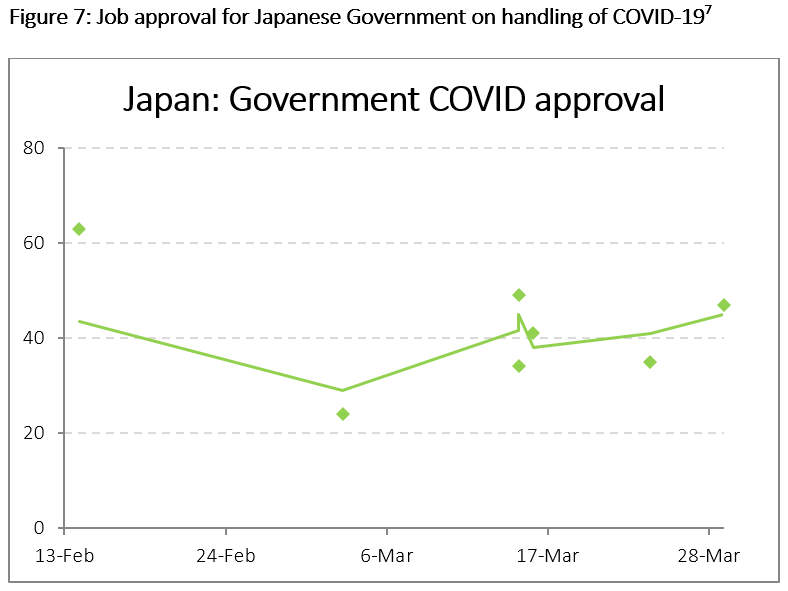
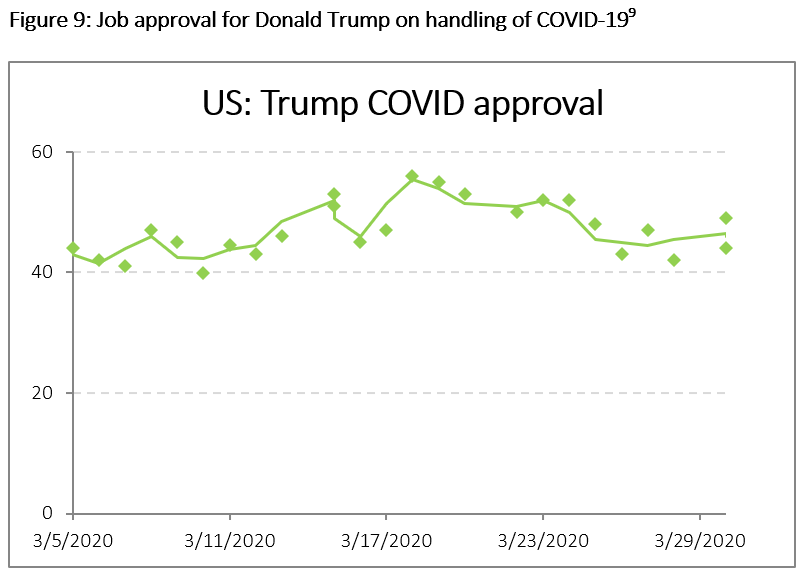
Previous editions noted that global polls generally showed national leaders getting higher approval marks for their job of handling COVID-19 than on their overall job approval, with many major leaders seeing rising rates of job approval on handling the pandemic. This week there are signs of some major leaders and governments leveling off or even losing ground on job approval.
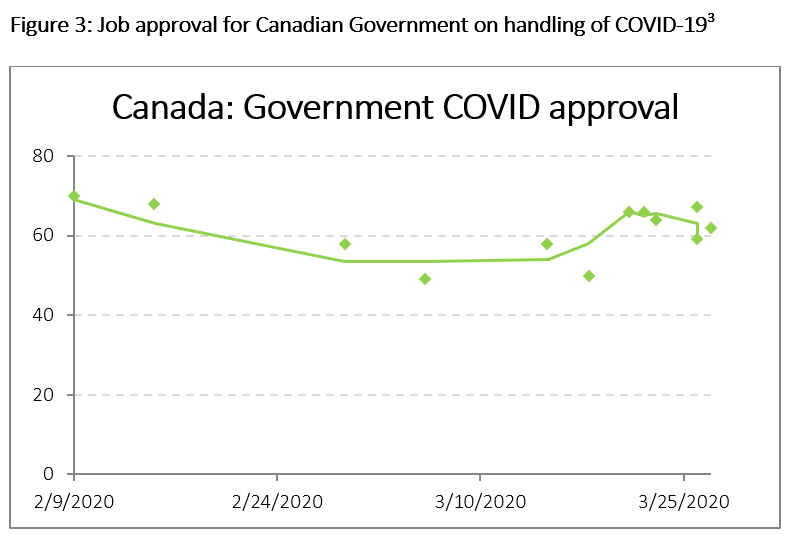
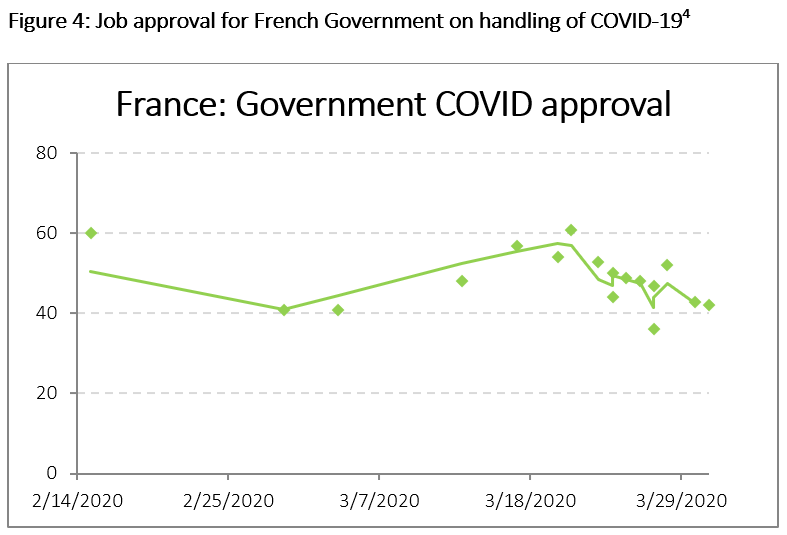
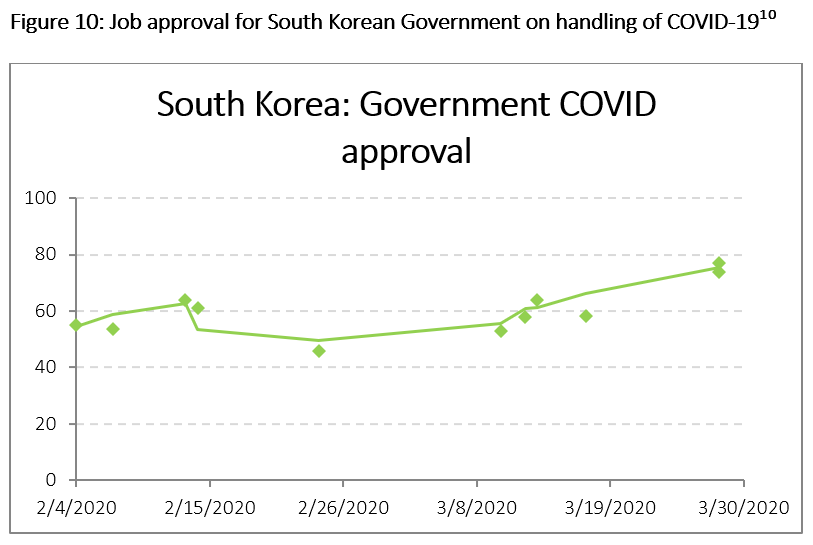
Figures 3-10 below show job approval levels for governments across eight countries – the G7 countries (Canada, France, Germany, Italy, Japan, US, UK) plus South Korea (given its scale and notable COVID-19 response). In five of the eight countries – Canada, Germany, Italy, Japan, and the US – there are signs of COVID-19 job approval leveling off. And in France approval of the government’s handling of the pandemic has dropped.
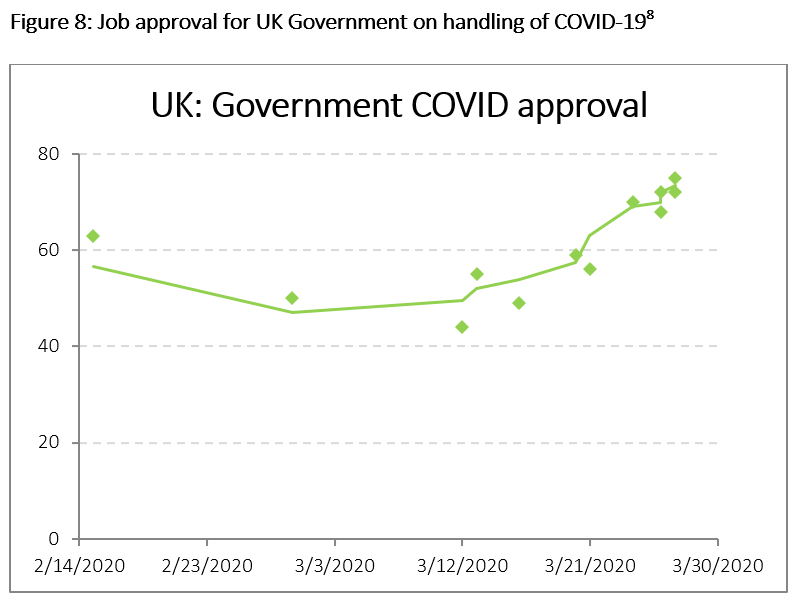
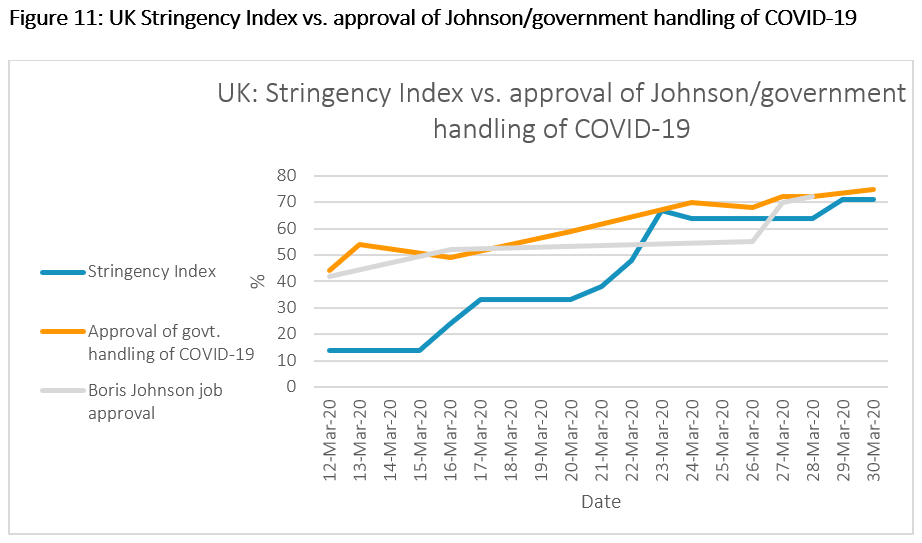
As these figures show, in two countries, governments continue to see rising levels of job approval on COVID-19. In the UK, Prime Minister Boris Johnson and his government enjoy rising scores on both overall job approval and their job on handling COVID-19. According to a March 30 YouGov poll, the government’s job approval overall is holding steady from last week at 52%, up from 39% on March 16. A March 27 YouGov poll shows his government’s job approval on handling COVID-19 is up 13 points from last week to 72%. It is worth noting, however, that this polling was completed before rising media criticism of the government on Wednesday and Thursday this week over testing and ventilators.
Similarly, in South Korea, President Moon Jae-in continues to see rising overall job approval, now up to about 53% in an April 1 poll. Approval of the government’s handling of the pandemic also continues to rise, now at 77% in a March 28 poll.
Mixed signs on relationship between job approval and “stringency” of policies toward COVID-19, but with some suggestions of impact
The global public opinion research suggests a willingness of many publics to embrace stringent measures to combat the virus. A set of Gallup surveys across 28 countries released March 26 finds an (unweighted) average 75-19% cross-national majority that agrees with the statement, “I am willing to sacrifice some of my human rights if it helps prevent the spread of the virus.” There was majority agreement in 26 of the 28 countries, plurality support in the US, and disagreement only in Japan.
Similarly, a March 21 Ipsos poll finds strong majority support (at least 66%) in all 14 countries it surveys for closing national borders until COVID-19 is contained, with at least marginally rising levels of support for such measures in 11 of the 12 countries with tracking data on the question (again, Japan is an outlier, with the lowest support, at 66%, and is the only case with time-series data in which support is not rising).
A Kantar survey of G-7 countries finds that, in all seven, far more people feel that their government’s measures do not go far enough (44%), rather than going too far (7%) (these averages are not population weighted), while an average of 43% felt the measures in their country were “relatively appropriate.”
A team of researchers at Oxford University has developed a single metric – a “Stringency Index” – to compare the overall national government responses to the pandemic across different states.[11] The higher the stringency score, the more steps the country has taken across seven policy areas for responding to COVID-19: school closings; workplace closings; canceling public events; closing public transport; international travel restrictions; internal travel restrictions; and public information campaigns.
While it is impossible to fully summarize and compare government responses to such a multi-faceted challenge in a single number, the Index provides an interesting early way to explore and compare national pandemic policy responses worldwide. It also provides an opportunity to explore possible relationships between the “stringency” of policy responses and levels of public approval for the government handling of the crisis.
A set of simple correlations across four key countries – the US, the UK, South Korea, and France – shows a mixed picture on the relationship between public support and the stringency of the government response, but with some evidence of support for strong policy responses. Correlation of course does not show causation, and causation may go in either or both directions here (stringent actions may boost public support; but high public support may also give leaders room for more stringent policies). It may also be that the correlation is spurious, and obscures more complex dynamics. We offer these correlations as a starting point for further inquiry, not as an effort to prove the relationship.
In the UK, there has been rising approval of both the government’s handling of COVID-19 and of PM Boris Johnson’s handling of his overall job. At the same time, as Figure 11 shows, there has been a relatively rapid rise in the country’s Stringency Index, from 14 on March 12 to 71 on March 30.
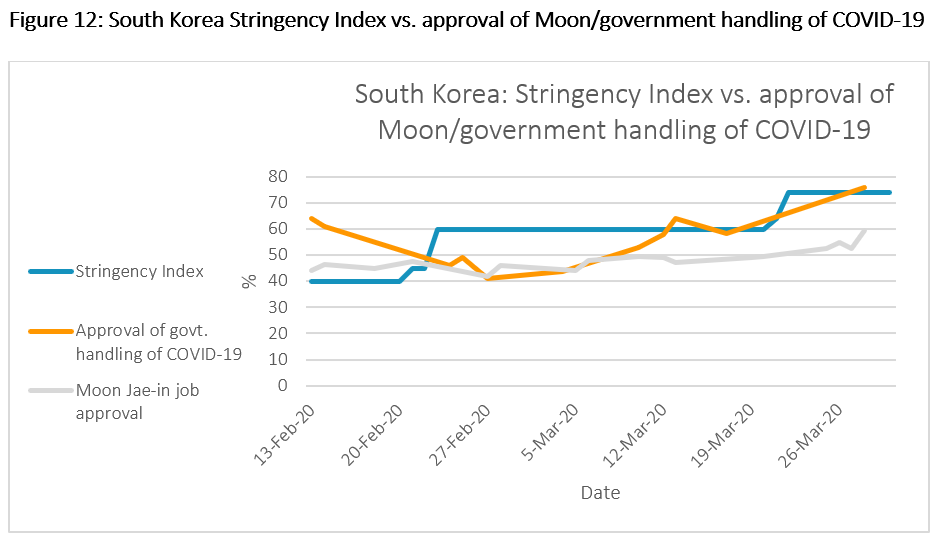
In South Korea, the country’s response to COVID-19 started earlier than most other countries and its Stringency Index score was already at a relatively strong 40 by mid-February (which is why Figure 12 starts earlier than for the other three countries). South Korea’s Stringency Index moved up to 60 in late February, just before approval ratings started to rise for both the government and the president. Its index has moved up somewhat again since then, to 74, but stayed at that level since March 22. In South Korea, both approval for the government’s response and the President’s overall job approval have continued to move up gradually since the late-February policy actions.
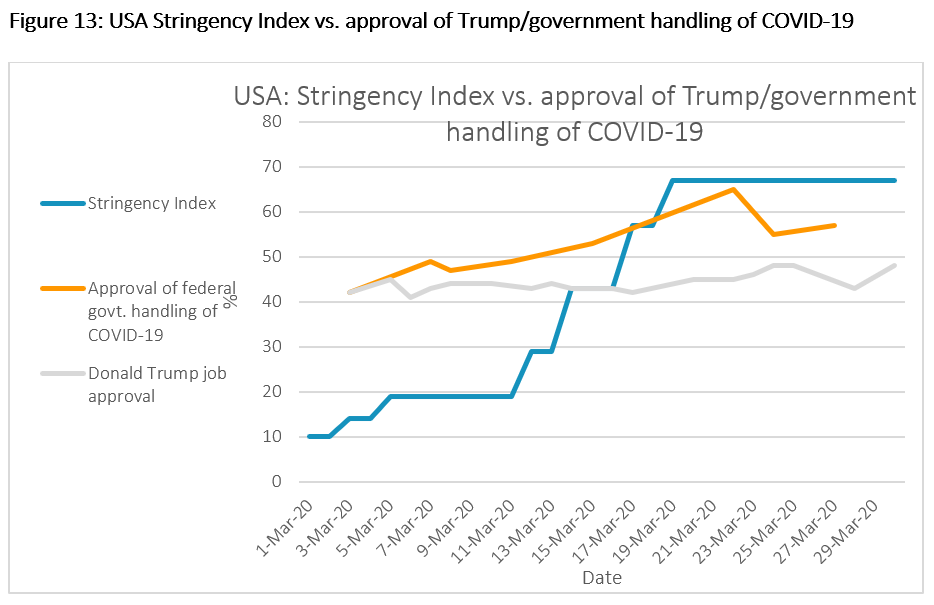
In the US, by contrast, public approval of the government’s response to COVID peaked in the third week in March and then declined somewhat, while overall job approval for President Trump has moved up only a few points during March, with evidence of leveling off since the third week in March. As Figure 13 reveals, the Oxford Index shows a relatively late start in creating more stringent policy responses, but with a sharp rise in the Index during March, topping off at 67 on March 19.
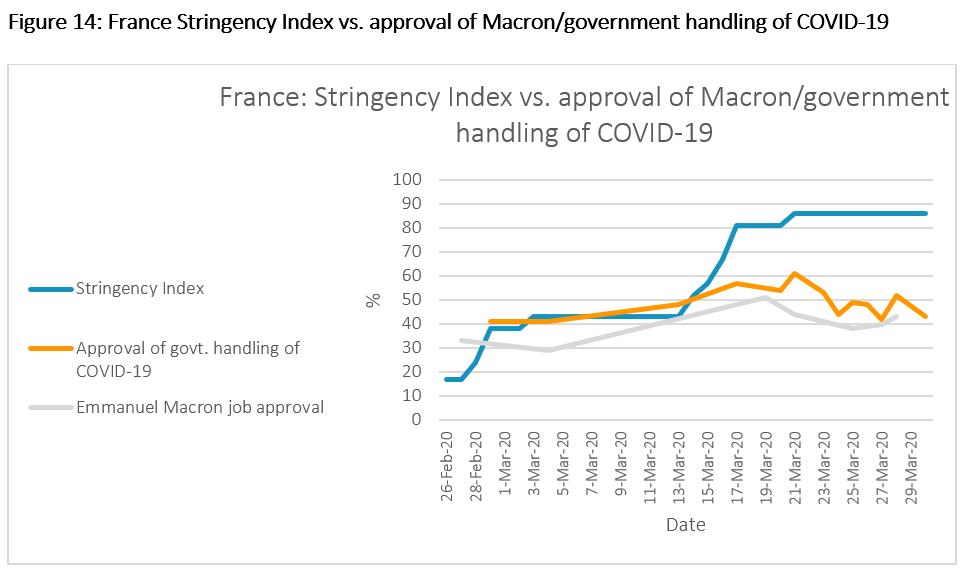
As Figure 14 shows, in France, the Stringency Index climbed sharply until the third week in March, and now has leveled off at a high score of 86 – the highest for the four countries examined here. Approval for the government’s handling of the crisis, and overall job approval for President Emanuel Macron, however, moved down significantly from their peaks around the third week in March.
These correlations provide mixed evidence about the ways in which government policy responses to COVID-19 may interact with public approval. There are of course many factors feeding public approval not captured in all this, including quality of public communications by leaders and their critics, government performance on non-pandemic issues, distance from the last election, and much more. But these correlations are interesting to consider at a time when leaders are evaluating the degree to which their citizens are willing to accept a range of restrictions in order to fight COVID-19. At least in some of these cases, the adoption of more stringent policies appears to have been followed by increases in public approval.
[1] Our first two installments of Pandemic PollWatch, on March 19 and March 27, reviewed a total of 122 polls from 45 different geographies (generally countries, but also polling on Hong Kong). This week’s analysis reviews an additional 88 polls, covering 66 countries and geographies, increasing the total number of geographies with reviewed public opinion data up to 75. Links to all new polls reviewed for this edition are listed in the Appendix. The Appendices for the first edition and second edition include links to all the earlier polls reviewed. As the Appendix notes, polls reviewed here vary significantly in methodology and reliability.
[2] Note for figures 1 and 2: GQR collected the most recent binary measures of concern or fear about the coronavirus in 55 countries and territories. Data comes from: Gallup International Association, Trespuntozero, YouGov, XP Investimentos, Kantar, Activa (in Chile and Peru), Opinion Way, About People, the Iranian Students Polling Agency, Amárach Research, TNS Ilres, Marketing Advisory Services, United Surveys, IRES, Go4Insight, Valicon, Gallup Korea, Ada Reseach and Consultancy, and Civiqs. Numbers of COVID-19 cases and deaths are from Johns Hopkins, and Worldometers, and reflect figures that correspond to the date of the COVID-19 concern poll for that place. Graphs reflect most recent polling data on level of concern in each country as of March 31.
[3] GQR collected the most recent binary measures of government job approval for handling the coronavirus. Data comes from: Nanos, Innovative Research Group, Ekos, Angus Reid, Research Co, Kantar, and Ipsos.
[4] GQR collected the most recent binary measures of government job approval for handling the coronavirus. Data comes from: Opinion Way, Elabe, YouGov, Gallup International Agency, Kantar, and Ipsos.
[5] GQR collected the most recent binary measures of government job approval for handling the coronavirus. Data comes from: YouGov, Gallup International Agency, the Winton Centre for Risk and Evidence Communication, Kantar, INSA Meinungstrend, and Ipsos.
[6] GQR collected the most recent binary measures of government job approval for handling the coronavirus. Data comes from: Ixe Institute, Gallup International Agency, Winpoll, Kantar, and Ipsos.
[7] GQR collected the most recent binary measures of government job approval for handling the coronavirus. Data comes from: Nikkei Asian Review, Kantar, Mainichi Shimbun, Election Dotcom, and Ipsos.
[8] GQR collected the most recent binary measures of government job approval for handling the coronavirus. Data comes from: Deltapoll, YouGov, Number Cruncher Politics UK, Kantar, Ipsos, and Opinium.
[9] GQR collected the most recent binary measures of government job approval for handling the coronavirus. Data comes from: Navigator Research, Civiqs, Gallup International Agency, YouGov, Monmouth University, Ipsos, the Harris Poll, Pew Research Center, SurveyMonkey, NBC News/Wall Street Journal, Change Research, CNN, and Morning Consult.
[10] GQR collected the most recent binary measures of government job approval for handling the coronavirus. Data comes from: Metrics Research, Gallup International Agency, Realmeter, and Gallup Korea.
[11] The Stringency Index, created by a team from Oxford University, enables researchers to track and compare government responses to the COVID-19 outbreak. It is an indexed average of the severity of seven types of government response: school closures, workplace closures, public event cancellations, public transport closures, public information campaigns, internal movement restrictions and international travel controls. Each type of response is scored, then averaged, to form the overall Stringency Index for a given country. Hale, Thomas and Samuel Webster (2020). Oxford COVID-19 Government Response Tracker. Data use policy: Creative Commons Attribution CC BY standard. More at: https://www.bsg.ox.ac.uk/research/research-projects/oxford-covid-19-government-response-tracker. GQR sees both strengths and limitations to this Index, and is not endorsing it, only noting it and using it as an early variable for inquiry. For example, one can question whether it makes sense to equally weight all seven factors that are averaged; the seven factors also do not capture important elements such as national testing protocols.
Appendix
This analysis is based on available global public opinion research on the COVID-19 pandemic. We welcome input from others – including insights about opinion trends and dynamics, and about additional public opinion research that is not included here.
Countries and territories with published public opinion data on COVID-19 at this point include:
- Afghanistan
- Algeria
- Argentina
- Armenia
- Australia
- Austria
- Azerbaijan
- Belgium
- Bolivia
- Bosnia & Herzegovina
- Brazil
- Bulgaria
- Canada
- Chile
- China
- Colombia
- Denmark
- Dominican Republic
- Ecuador
- Egypt
- El Salvador
- Finland
- France
- Georgia
- Germany
- Greece
- Guatemala
- Hong Kong
- Hungary
- India
- Indonesia
- Iran
- Ireland
- Israel
- Italy
- Japan
- Kazakhstan
- Kenya
- Latvia
- Lithuania
- Luxembourg
- Malaysia
- Malta
- Mexico
- Morocco
- North Macedonia
- The Netherlands
- New Zealand
- Nigeria
- Norway
- Pakistan
- Palestine
- Peru
- Philippines
- Poland
- Portugal
- Romania
- Russia
- Saudi Arabia
- Singapore
- Slovakia
- Slovenia
- South Korea
- Spain
- Sweden
- Switzerland
- Taiwan
- Thailand
- Turkey
- Ukraine
- United Arab Emirates
- United Kingdom
- United States
- Venezuela
- Vietnam
The reliability of the public opinion data from these geographies varies – and affects the analysis – for several reasons. First, some of these countries, such as China, Russia, and Saudi Arabia, are “not free” (according to rankings by Freedom House) and respondents in these countries may not feel free to give their actual opinions in a survey.
Second, the methodologies used in these surveys vary, and few are “gold standard” quality. The pandemic has driven researchers in most geographies to rely on online surveys, which generally do not have probability-based samples and can suffer from opt-in bias. Sample sizes and quality control procedures also vary across the available surveys.
The polls reviewed for this edition of Pandemic PollWatch (with links in all possible cases) are listed below. Please refer to the first edition and second edition of Pandemic PollWatch for a list and links for all previous polls reviewed.
Argentina
- Trespuntozero; March 24-26, 2020; 1,000 adults; not specified; link
Australia
- Essential Vision; March 29, 2020; 1,086 adults; online; link
- Roy Morgan Research Institute; March 29, 2020; 988 adults; online; link
- Roy Morgan Research Institute; March 28, 2020; 2,069 adults; SMS; link
Belgium
- Test-Achats; March 25, 2020; 1,000 adults; unspecified; link
Canada
- Leger; March 27-29, 2020; 1,590 Canadians & 1,004 Americans; link
- DART & maru/Blue Voice Canada Polls; March 27-29, 2020; 1,520 adults; online; link
- Nanos/Globe and Mail; March 24-27, 2020; 1,013 adults; telephone; link
- Innovative Research Group; March 24-26, 2020; 2,411 adults; online; link
- Ekos; March 19-26, 2020; 2,304 adults; landline and cellphone; link
- Abacus Data; March 20-24, 2020; 2,309 adults; online; link
- Angus Reid; March 20-23, 2020; 1,664 adults; online; link
Chile
- Activa Research; March 26-27; 1,851 adults; online; link
- Cadem; March 25-27, 2020; 707 adults; CATI; link
Colombia
- Polimetrica; March 27-31, 2020; 1,821 adults; telephone; link
Denmark
- Voxmeter; March 23-29, 2020; 1,071 adults; telephone; link
Finland
- Alma; March 20-27, 2020; 1,200 adults; telephone & online; link
- Yle; March 23-24, 2020 1,805 adults; link
France
- Odoxa/Le Figaro; March 31 – April 1, 2020; online; link
- OpinionWay; March 30-31, 2020; CAWI; link
- Elabe/BFMTV; March 31, 2020; 1,004 adults; online; link
- OpinionWay; March 28-29, 2020; 1083 adults; CAWI; link
- IFOP; March 19-28, 2020; 1,930 adults; online; link
- IFOP; March 26-27, 2020; 1,007 adults; online; link
- YouGov; March 26-27, 2020; 1,010 adults; online; link
Germany
- YouGov; March 27-30, 2020; 2,032 adults; unspecified; link
- Forsa; March 23-25, 2020; 1,502 adults; unspecified; link
- YouGov; March 20-23, 2020; 2,035 adults; unspecified; link
- INSA/BILD; March 20-23, 2020; 2,070 citizens; unspecified; link
Greece
- Opinion Poll; March 23-26, 2020; 1,095 adults; telephone and web; link
- QED; March 21-23, 2020; 1,000 15+ year olds; telephone; link
Hong Kong
- Chinese University’s Centre for Communication and Public Opinion; March 19-27, 2020; 847 adults; link
Ireland
- Red C; March 20-25, 2020; 1,062 adults; online; link
Italy
- Ixe; March 30-31, 2020; 1,000 adults; CATI, CAMI, CAWI; link
- Brand News; March 24-31, 2020; 262 professionals; link
- SWG; March 25-27, 2020; 800 respondents; CATI, CAMI, CAWI; link
- EuroMediaResearch; March 25, 2020; 800 interviews; CATI, CAMI; link
- Demopolis Institute; March 30, 2020; 1,500 adults; not specified; link
- Ipsos; 24-26 March, 2020; 1,000 adults; mixed-mode; link
Japan
- NHK; March 28-29, 2020; 1,300 adults; unspecified; link
- Yomiuri Shimbun; March 20-22, 2020; unspecified; unspecified; link
- Go2senkyo; March 14-15, 2020; 1,000 adults; online; link
Mexico
- Mitofsky; March 27-29, 2020; 1,000 adults; online; link
Netherlands
- I&O Research; March 26-30, 2020; 2,342 adults; link
Norway
- Norstatfor NRK/Aftenposten Newspaper; March 23-29, 2020; 953 people; link
- Kantar; March 25-31, 2020; 980 people; link
- Statista; March 18-19, 2020; 1,468 people; link
Slovakia
- Go4Insight; 17-25 March, 2020; 1,000 15-75 year olds; not specified; link
South Korea
- Gallup Korea; March 24-26, 2020; 1,001 adults; phone; link
Mexico
- GEA-ISA; March, 2020; sample size not specified; not specified;link
Poland
- IBRiS; March 27-28, 2020; 1,100 people; CATI; link
- WPolityce; March 27-30, 2020; 1,062 adults; CAWI; link
- ARC Ryneki Opinia; March 24, 2020; 1,033 adults; CAWI; link
Romania
- Grupulde Studii Socio Comportamentale Avangarde; March 28-29, 2020; 950 adults; telephone; link
Russia
- FOM; 15-22 March (published 27 March); not specified; link
- VKontakte; March 31, 2020; 1240 respondents; link
- Stopkoronavirus.rf; March 31, 2020; link
- Health Mail.ru / All Pharmacies; March 27-30, 2020; 1300 respondents; link
Turkey
- ADA Araştırma; 22-25 March; 2,000 adults; not specified; link
UK
- Deltapoll; 26-27 March, 2020; 1,545 adults; online; link
- YouGov; 26-27 March, 2020; 2,105 adults; online; link
- YouGov; 24-25 March, 2020; 2,099 adults; online; link
- YouGov; March 30, 2020; 1,631 adults; online; link
- Ipsos: March 27-30, 2020; 1,072 adults; online; link
- Ipsos; March 26-30, 2020; approx. 2,000 adults; online; link
- YouGov tracker; March 23-30, 2020; 2052-2972 adults; online; link
- Opinium; March 27, 2020; 2,006 adults; online; link
- Ipsos; March 24-26, 2020; 1,010 adults; online; link
- YoungMinds; March 20-25, 2020; 2,111 under 25s; not specified; link
- YouGov; March 23-24, 2020; 1,681 adults; online; link
USA
- Civiqs; March 29, 2020; 13,785 adults; online; link
- YouGov; March 26-28, 2020; 1,000 adults; online; link
- Reuters/Ipsos; March 26-27, 2020; 1,112 adults; online; link
- Navigator; March 24-27, 2020; 1,022 adults; online; link
- Yahoo News/YouGov; March 25-26, 2020; 1,579 adults; link
- Monmouth University; March 18-22, 2020; 851 adults; phone; link
- Navigator Tracker; March 27-Arpil 1, 2020; 1.010 respondents; online; link
- Gallup Panel; March 27-29, 2020; online; link
- Grinnell College National Poll; March 27-30, 2020; 1,009 adults; link
- DHM Research; March 24-30, 2020; 500+ Oregonians; link
- Heart+MindStrategies for Strada Education; March 25-26, 2020; 1,006 adults; link
- Data for Progress; March 22-23, 2020; 2,349 registered voters; unspecified; link
- University of Maryland; March 20, 2020; 2,395 respondents; mail and telephone; link
Multi-Country
- Gallup International; March, 2020; 28 countries; varied sample/country; face-to-face, telephone or online; link
- YouGov; April 2, 2020; sample unavailable; online; link
- Dalia; March 24-26, 2020; min. 500 adults/country; online; link
- Mitofsky/TResearch; March 22-25, 2020; 500 adults/country; online; link