
It’s hard, but harder for the Tories than Labour
Brexit, so we were told, is about taking back control. The restoration of sovereignty; the repatriation of powers. Parliament will be in charge once again. Of course most MPs from all parties didn’t actually want these powers to come back to Britain, they were quite happy with the old arrangement. One reason for this is that possessing certain powers means people expect you to wield them.
The newly-acquired power to cut immigration is surely the most testing such case. Expectations for reduced immigration post-Brexit are enormous, yet without migrants British industry would face serious problems. The British car industry’s representative body the SMMT says the sector is currently trying to fill 5,000 open positions. Perhaps in an ideal world there would be enough Brits with the necessary skills to fill those jobs; we don’t live in that world. The SMMT is adamant that free movement between Britain and the EU must continue.
The government has to choose between what’s good for our economy and what people want it to do, because among the British public the idea of cutting immigration is remarkably uncontroversial. When we ask if people agree or disagree with the statement “It is essential for the immigration system to reduce the number of migrants coming to Britain,” 58% agree and only 18% disagree. It’s not just Brexiteers either: there is net agreement with this principle among both Remain and Leave voters. Also Labour, Conservative and Liberal Democrat voters; men and women; the 18-34s, the 35-54s and the 55 pluses; all the social grades from A to E; white people and ethnic minorities; the people of Scotland, Wales, the North, Midlands and South; Londoners, for goodness’ sake.
And yet politicians seem to be edging toward a position where migration will not be cut. On 27 March, speaking on the BBC’s Question Time, David Davis said “I cannot imagine that the [immigration] policy will be anything other than that which is in the national interest. Which means that from time to time we will need more, from time to time we will need less.” This is a strong message to industry that their interests will be protected, but risks disappointing voters. Over the next couple of years Davis and his colleagues will have to find a way to sell continued high migration to a country that thought it had voted to get rid of it. For the Conservatives in particular this is a liability. It might be an opportunity for Labour, if the party is prepared to take it.
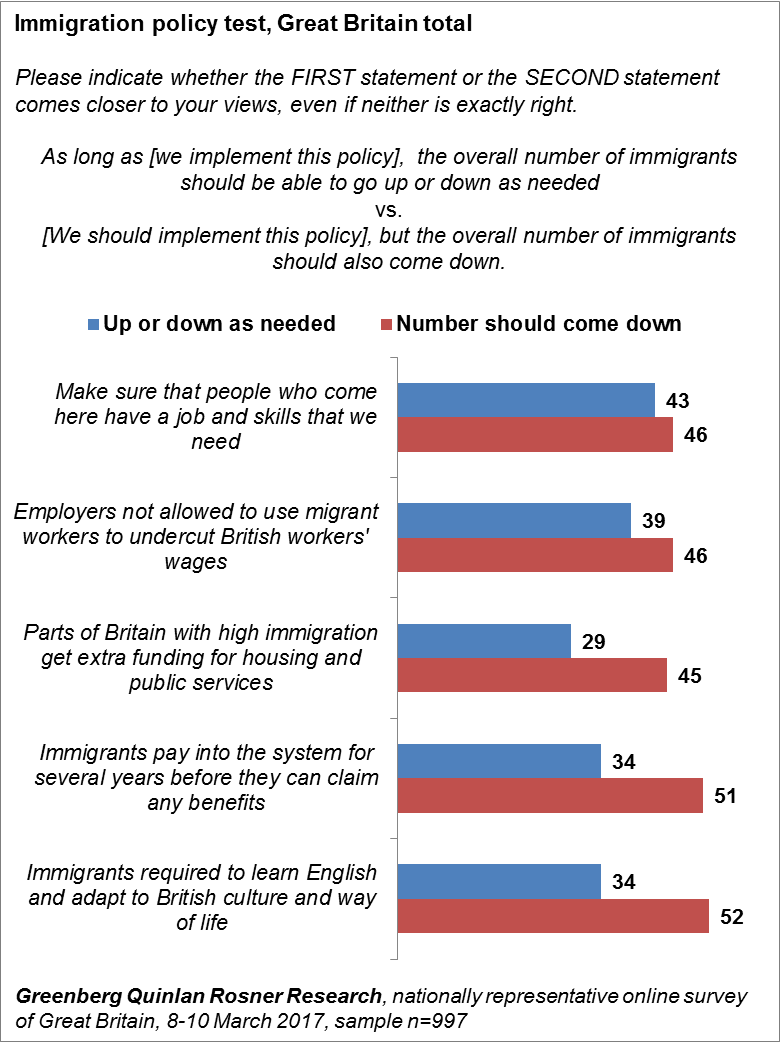
Years’ worth of focus groups and polling for the Labour party and others showed us how hard it is to shift British people’s certainty about cutting migration. In our latest poll we wanted to find out whether there were any circumstances under which people would accept immigration going up as well as down. We designed it to take account of the pushback we’ve heard so many times when testing immigration policy ideas: “sure, sounds good, but let’s get the numbers down too!” So for each of five possible controls on migration we asked people to choose between two statements: “As long as [we implement this policy], the overall number of immigrants should be able to go up or down as needed,” OR “[We should implement this policy], but the overall number of immigrants should also come down.”
We tested five different ideas like this, and the short answer is: the government faces serious trouble. For all five, more people thought we should still cut migrant numbers than felt comfortable with numbers going up as well as down:
Normal
0
false
false
false
EN-US
X-NONE
X-NONE
/* Style Definitions */
table.MsoNormalTable
{mso-style-name:”Table Normal”;
mso-tstyle-rowband-size:0;
mso-tstyle-colband-size:0;
mso-style-noshow:yes;
mso-style-priority:99;
mso-style-parent:””;
mso-padding-alt:0in 5.4pt 0in 5.4pt;
mso-para-margin-top:0in;
mso-para-margin-right:0in;
mso-para-margin-bottom:10.0pt;
mso-para-margin-left:0in;
line-height:115%;
mso-pagination:widow-orphan;
font-size:11.0pt;
font-family:”Calibri”,sans-serif;
mso-ascii-font-family:Calibri;
mso-ascii-theme-font:minor-latin;
mso-hansi-font-family:Calibri;
mso-hansi-theme-font:minor-latin;
mso-bidi-font-family:”Times New Roman”;
mso-bidi-theme-font:minor-bidi;}
But the political breakdowns tell another story. On “make sure that people who come here have a job and skills that we need,” Labour voters picked flexible migration over cutting the numbers by a 51-38 margin. On “As long as employers are not allowed to use migrant workers to undercut British workers’ wages,” they picked flexibility over cutting numbers 53-34. These are solid margins. Conservative voters by contrast prefer to cut migrant numbers in either case (by 55-41 in the case of the jobs/skills policy and by 59-34 for undercutting). But Conservative voters who would consider Labour (they do exist, believe it or not) are in favour of flexible migration under the jobs/skills scenario.
All this means that Labour could have a more economically and electorally viable immigration policy than the Conservatives. This of course assumes that Labour is interested in things that are both economically and electorally viable; on that, the evidence isn’t clear.
Politico has covered these results here.
Normal
0
false
false
false
EN-US
X-NONE
X-NONE
/* Style Definitions */
table.MsoNormalTable
{mso-style-name:”Table Normal”;
mso-tstyle-rowband-size:0;
mso-tstyle-colband-size:0;
mso-style-noshow:yes;
mso-style-priority:99;
mso-style-parent:””;
mso-padding-alt:0in 5.4pt 0in 5.4pt;
mso-para-margin:0in;
mso-para-margin-bottom:.0001pt;
mso-pagination:widow-orphan;
font-size:10.0pt;
font-family:”Times New Roman”,serif;}
Peter McLeod is a Vice President with GQR and runs the firm’s London office. GQR worked for Labour from the mid ‘90s until May 2015. We have no relationship with the party’s current leadership and are not seeking one.
The survey described in this article is a nationally representative online survey of Great Britain conducted from 8 to 10 March 2017. Results are weighted to be representative of the total population by age, gender, region, socioeconomic grade, ethnicity and past voting behaviour.
Download data tables showing the results here.
For more information contact info@gqrr.com or tweet Peter McLeod (@mcleodp).
Normal
0
false
false
false
EN-US
X-NONE
X-NONE
/* Style Definitions */
table.MsoNormalTable
{mso-style-name:”Table Normal”;
mso-tstyle-rowband-size:0;
mso-tstyle-colband-size:0;
mso-style-noshow:yes;
mso-style-priority:99;
mso-style-parent:””;
mso-padding-alt:0in 5.4pt 0in 5.4pt;
mso-para-margin-top:0in;
mso-para-margin-right:0in;
mso-para-margin-bottom:10.0pt;
mso-para-margin-left:0in;
line-height:115%;
mso-pagination:widow-orphan;
font-size:11.0pt;
font-family:”Calibri”,sans-serif;
mso-ascii-font-family:Calibri;
mso-ascii-theme-font:minor-latin;
mso-hansi-font-family:Calibri;
mso-hansi-theme-font:minor-latin;
mso-bidi-font-family:”Times New Roman”;
mso-bidi-theme-font:minor-bidi;}